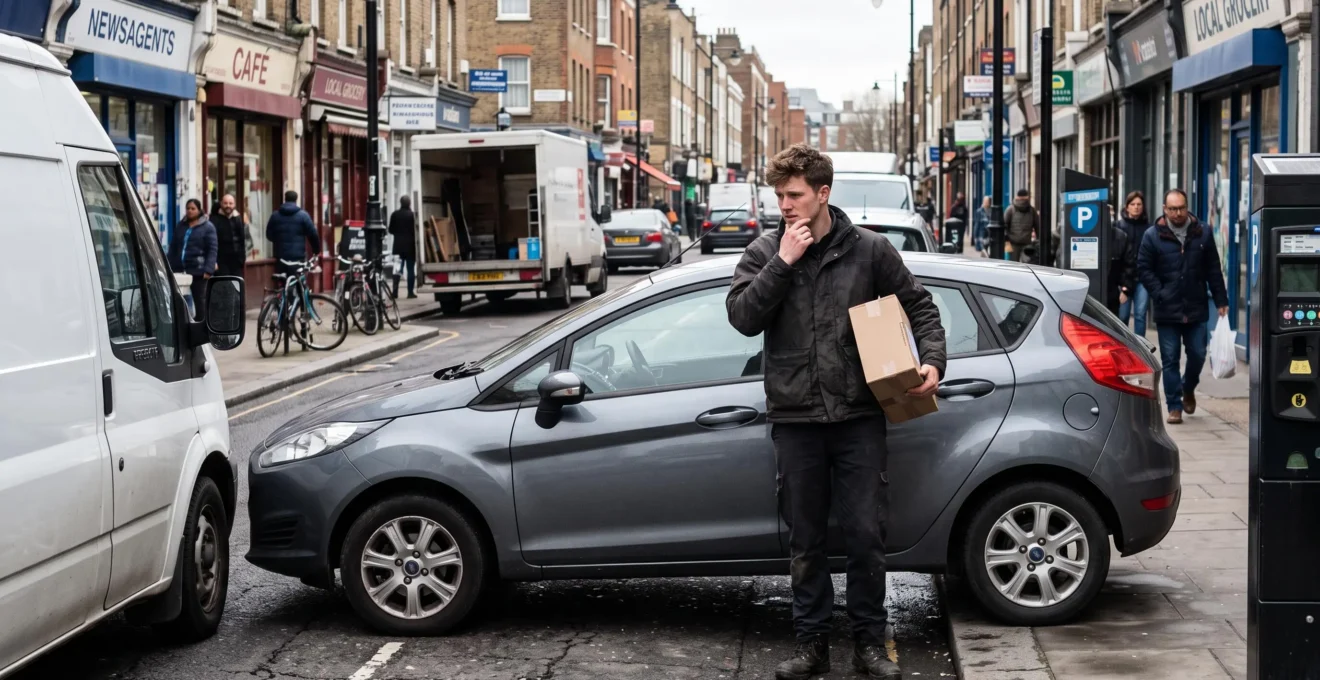
A delivery route can look perfectly manageable on a map and still finish an hour behind schedule. The distance is short, the stops are close together, and the navigation app shows no major delays. Yet the driver keeps arriving late.
The problem is often the gap between estimated driving time and actual delivery completion time. Finding legal parking, walking to entrances, waiting for customers, recording proof of delivery and navigating changing traffic conditions all consume time. A minor vehicle defect can disrupt the entire schedule.
Improving on-time delivery performance means measuring the complete journey between completed drops, not simply reducing kilometres or miles driven. Drivers need realistic stop allowances and clear decisions they can make on the road. Dispatchers need better historical data, sensible delivery windows and a practical way to respond when conditions change.
The most effective fixes start with understanding where the time actually goes, then adjusting route sequencing, buffers, vehicle readiness and performance monitoring accordingly.
What makes delivery routes more reliable?
- Measure complete stops: Include parking, walking, customer contact and proof of delivery instead of relying on driving estimates alone.
- Protect important delivery windows: Use observed delays and flexible stop sequencing rather than adding the same buffer everywhere.
- Prevent avoidable disruption: Check vehicle readiness before departure and monitor recurring routes for gradual performance deterioration.
- Why Do 5-Minute Stops Turn Into 15 Minutes on Urban Delivery Routes?
- How to Add Realistic Time Buffers to Deliveries Without Missing Your Next Slot?
- Nearest-First or Time-Window-First: Which Gets More Drops Done in 4 Hours?
- The Minor Dashboard Warning Light Drivers Ignore That Can End Your Shift Early
- When Should You Do Pre-Shift Checks to Avoid Losing 30 Minutes Mid-Route?
- Why Do Recurring Routes Get Slower After 6 Weeks Without You Noticing?
- Why Can a Small Car Complete More Drops in City Centres Than a Van?
- How to Make Recurring Delivery Routes Predictable When Traffic Changes Daily?
Why Do 5-Minute Stops Turn Into 15 Minutes on Urban Delivery Routes?
A five-minute urban delivery stop can take fifteen minutes when the estimate only covers the handover. Finding legal parking, walking to the address, gaining building access, contacting the customer and recording delivery confirmation all add time. These activities are often invisible in standard driving estimates, even though they determine when the next delivery can begin.
Consider the complete timeline of a single drop. The vehicle reaches the destination area, but the driver must first locate a permitted stopping space. After securing the vehicle, the driver retrieves the parcel, reaches the correct entrance, completes the handover, records proof of delivery and returns to the vehicle.
Only then can the next journey begin. In apartment buildings, secured offices or busy retail streets, access arrangements may take longer than the drive itself.
Parking is particularly difficult to estimate from a route map. The Federal Highway Administration‘s urban freight management primer identifies limited loading-space availability and competition for curbside space as operational challenges for urban freight deliveries.
A street may be geographically close to the previous stop while offering few practical loading opportunities. Drivers must follow local parking and stopping rules; hazard lights do not automatically make an otherwise prohibited stop lawful.
The scheduling impact becomes clear when small errors repeat. In a hypothetical 20-stop route, underestimating each stop by four minutes creates 80 minutes of unplanned work. No traffic jam is needed for the schedule to fail.
To establish realistic allowances, record arrival near the address, legal parking time, delivery completion and departure time. Separate residential houses, retail premises and access-controlled buildings. For each category, calculate the median and a higher-percentile duration, such as the 90th percentile, once sufficient observations are available.
That produces a usable distinction between a normal stop and one requiring extra scheduling protection.
Once real stop durations are visible, the next challenge is protecting delivery windows without making the entire route unnecessarily slow.
How to Add Realistic Time Buffers to Deliveries Without Missing Your Next Slot?
Realistic delivery buffers should reflect the uncertainty of each route segment and stop type rather than adding an identical allowance to every delivery. Use historical travel and service-time overruns by location and time of day, then protect the next strict appointment. The aim is to absorb likely delays without reserving so much time that delivery capacity collapses.
A static buffer adds the same amount to each stop or route segment. It is simple to administer but assumes that every location carries similar delay risk. A dynamic buffer changes according to conditions such as congestion, parking availability, building access and appointment flexibility.
For example, a suburban doorstep delivery and a city-centre office delivery should not automatically receive the same allowance. Their service requirements may be completely different.
Build buffers from observed overruns rather than intuition. Keep travel-related delays separate from stop-service delays so dispatchers know whether to change departure timing, stop order or service allowances.
| Observed condition | Planning response | What to monitor |
|---|---|---|
| Consistent travel times and simple access | Use a smaller allowance supported by recorded variability | Travel-time overruns |
| Rush-hour travel uncertainty | Increase protection around affected journey segments | Delay distribution by departure period |
| Secure buildings and uncertain customer access | Allow more variable service time | Arrival-to-departure duration |
| Strict appointment followed by flexible drops | Protect the appointment and rearrange flexible work around it | Late-arrival rate and completed drops |
Suppose the next committed appointment has a latest permissible arrival time. Compare that deadline with the predicted arrival plus a chosen allowance for uncertainty. If the protected arrival exceeds the deadline, the current sequence is not sufficiently reliable.
The trade-off is measurable: increasing buffers may improve punctuality but can reduce the stops that fit into a shift. A 2025 Sustainability study on delivery routing under travel-time uncertainty found that uncertainty-aware routing reduced late deliveries in its model, while requiring moderately longer planned routes. The findings support evaluating reliability alongside distance, not prescribing one universal buffer.
Buffers should also be recoverable. When a route runs ahead, retain the protected margin until later constraints are clear. When delays consume it, consider moving a flexible nearby stop, provided doing so does not compromise a customer commitment.
A buffer cannot rescue every poorly ordered route. Stop sequencing determines whether the available time is used where it matters most.
Nearest-First or Time-Window-First: Which Gets More Drops Done in 4 Hours?
Neither nearest-first nor time-window-first routing always produces more completed deliveries in four hours. Nearest-first can reduce driving when appointments are flexible, while time-window-first protects strict customer commitments. The stronger approach is usually a hybrid: secure time-critical stops, then fill the remaining gaps with nearby deliveries whose estimated completion times remain feasible.
Nearest-first routing selects the next geographically or temporally closest stop. It can avoid unnecessary crossing of a delivery zone, but proximity alone cannot protect appointments later in the shift.
Time-window-first routing gives priority to stops with strict arrival requirements. This reduces the risk of missing important slots but can create repeated journeys across the same area if appointment times are widely separated.
Before selecting either strategy, map the distribution of committed windows. When several narrow windows occur close together, timing constraints will dominate. When windows are broad and stops are geographically dispersed, minimizing travel becomes more influential.
| Decision factor | Nearest-first | Time-window-first |
|---|---|---|
| Primary objective | Reduce movement between nearby stops | Protect committed appointment times |
| Most suitable conditions | Flexible windows and reliable access | Narrow or clustered appointments |
| Main failure risk | Critical appointments become unreachable on time | Extra travel reduces available delivery capacity |
| Best adjustment | Reserve critical slots before selecting nearby drops | Insert flexible nearby drops between protected appointments |
Compare competing schedules using predicted completed, on-time drops, not simply kilometres driven. Include realistic parking and service times in both candidates.
A route engine may assign a short journey to an address across a busy intersection, while the practical delivery entrance requires a longer approach. Restricted turns, one-way systems, pedestrian access and legal parking can all change which stop is operationally closest.
A workable hybrid sequence follows four decisions:
- Identify strict delivery windows and their latest feasible arrival times.
- Place those stops into the schedule using realistic travel and service estimates.
- Fill available gaps with flexible stops selected by practical travel time.
- Recheck feasibility halfway through the shift using actual completed-stop data.
For a four-hour comparison, evaluate both candidate schedules against the same parcels, conditions and service requirements. Count completed on-time drops, missed commitments, total driving time and unused capacity.
The results reveal which strategy is better for that operation, rather than assuming one sequencing rule always wins.
Even an excellent route sequence depends on a vehicle capable of completing the shift without interruption.
The Minor Dashboard Warning Light Drivers Ignore That Can End Your Shift Early
A dashboard warning that initially appears minor can interrupt an entire delivery shift if it indicates a developing mechanical or electrical problem. Tyre-pressure warnings, charging-system faults and temperature alerts deserve different responses. The safe decision depends on the specific warning, vehicle behaviour and manufacturer instructions—not on how many deliveries remain or how close the next stop appears.
The operational danger is that an unresolved defect can become a breakdown. A tyre losing pressure may deteriorate further during urban driving. A charging-system warning may indicate a problem that eventually leaves the vehicle unable to restart. Temperature warnings can indicate conditions that risk engine damage.
These possibilities do not mean every amber light predicts an imminent breakdown. The symbol, associated message and vehicle response matter.
Drivers need a rapid triage process rather than a blanket assumption that an amber warning allows them to continue.
- Stop safely and do not continue: A red oil-pressure warning, serious overheating indication, critical brake warning or obvious loss of safe vehicle control requires immediate attention according to the vehicle’s safety instructions.
- Inspect before deciding: An amber tyre-pressure alert calls for a safe stop and a tyre assessment. An actual puncture or unsafe tyre condition must be addressed before driving further.
- Consult vehicle-specific guidance: Other amber alerts may have different operating restrictions. Read the message, consult the handbook and follow the fleet’s defect-reporting procedure.
Distance remaining is relevant only after the vehicle has been assessed as safe to operate. A short remaining route is not justification for continuing with an unsafe defect.
For dispatchers, the decision is also operational. If a vehicle must stop, immediately identify affected appointments, arrange permitted vehicle or driver reassignment where available, and communicate revised delivery expectations.
That protects customer trust more effectively than waiting for a full breakdown before changing the schedule.
The most controllable warning-light decision is often the one made before the vehicle leaves the depot.
When Should You Do Pre-Shift Checks to Avoid Losing 30 Minutes Mid-Route?
Pre-shift vehicle checks should happen before the journey begins, with essential roadworthiness checks completed before loading where practical and load-security checks repeated after loading. This sequence helps drivers identify existing defects and problems introduced during preparation. A brief, structured inspection can prevent avoidable disruption, although no checklist guarantees that a vehicle will remain trouble-free.
Start with items capable of affecting safety, roadworthiness or the vehicle’s ability to finish the route. These include tyres, visible leaks, required fluid levels, lights, warning indicators and obvious damage.
After loading, confirm that parcels and equipment cannot move dangerously, access points are secured and the vehicle remains safe to operate.
The UK’s DVSA guidance on daily van walkaround checks identifies tyres, warning lights, fluids, lighting and load security among the items drivers should inspect. Its specific regulatory scope is England, Scotland and Wales; drivers elsewhere should follow their own applicable rules and fleet requirements.
A structured check should not become an exercise in completing paperwork without examining the vehicle. Nor should a short inspection be treated as permission to skip mandatory checks.
Consider a hypothetical scheduling comparison. A driver performs a structured check before departure, while another skips it and later experiences a 30-minute interruption caused by an issue that could have been detected. The second route loses 30 minutes of delivery capacity; the first spends some time checking beforehand. This illustrates the potential trade-off, not a measured breakdown-prevention rate.
A useful inspection record should identify what was checked, any defect discovered, its reported status and whether the vehicle was cleared for use.
Five checks to complete before the first delivery
- Inspect tyres for visible damage, suitable inflation and applicable tread requirements. Record the inspection result or any defect.
- Check dashboard warnings, required lighting and visible fluid leaks or relevant fluid levels. Record any abnormal indication.
- Confirm that doors, mirrors, glazing and other required safety equipment are fit for use. Produce a pass or defect entry.
- After loading, inspect parcel restraint, load stability and secured doors. Confirm that the load-security check is complete.
- Report identified defects and obtain the required clearance before departure. Produce a completed vehicle-check record with unresolved issues clearly flagged.
Drivers using the same vehicle on recurring routes should consult previous defect reports and known maintenance issues. Familiarity can improve targeted attention, but it should not replace required daily safety inspections.
Where defects are found, the response should follow their severity and applicable requirements. Dangerous defects must be repaired before driving continues.
Vehicle readiness reduces one source of uncertainty, but an apparently familiar route can still deteriorate gradually even when the van or car remains operational.
Why Do Recurring Routes Get Slower After 6 Weeks Without You Noticing?
Recurring delivery routes can become slower over six weeks because traffic patterns, parking availability, customer access and vehicle condition change gradually. Drivers often adapt to each day’s small inconvenience without recognizing the cumulative effect. Comparing current results with a recorded baseline, rather than yesterday’s route alone, makes this performance drift easier to detect and investigate.
A recurring route feels predictable because the addresses are familiar. Drivers know the preferred approach roads, entrances and usual stopping locations. That familiarity can conceal a slow increase in total journey duration.
New road restrictions may require different turns. Loading spaces may become less available. A new commercial development can affect traffic at certain times. Vehicle defects or performance changes may also create operational interruptions.
None of these changes needs to be dramatic. They can accumulate until the old delivery schedule becomes unrealistic.
The six-week interval is a useful comparison horizon, not a universal deterioration threshold. Some routes change faster, while others remain stable much longer.
To detect drift, preserve a reference route duration under comparable operating conditions. Account for weekday, weather category, parcel volume, number of stops and relevant time windows.
Then compare current results with the appropriate baseline. A longer route carrying substantially more parcels is not necessarily performing worse.
Hypothetical example: detecting gradual route drift
Suppose a recurring delivery route originally takes 180 minutes under comparable conditions. Six weeks later, its median duration is 198 minutes. That represents an 18-minute increase, or 10% relative to the initial baseline.
If the dispatcher has chosen an internal review threshold of 8%, this route should be investigated. The figures and threshold are illustrative, not industry benchmarks. The review should isolate travel, parking and service-time changes before deciding whether to restructure the route.
Define the review threshold using the business’s own service commitments and observed variability. A route with narrow delivery windows may need investigation sooner than one with flexible appointments.
Drivers should also record unusual conditions so recurring delays can be distinguished from one-off incidents.
Importantly, the route may still show exactly the same distance on the map. Its operational duration has changed even though its geometry has not.
Once the drift has been identified, route design may need to change—including the type of vehicle assigned to dense urban areas.
Why Can a Small Car Complete More Drops in City Centres Than a Van?
A small car can complete more city-centre deliveries than a van when easier legal parking, suitable access and shorter walking distances save enough time across multiple stops to outweigh its lower carrying capacity. That advantage is conditional. Vans may remain more productive when parcel volume, package dimensions or depot reload requirements make a smaller vehicle impractical.
The key metric is not vehicle size itself but productive delivery time per completed drop.
A smaller car may be easier to manoeuvre through narrow streets and fit into permitted spaces that accommodate its dimensions. This can reduce parking searches and the distance between the vehicle and the customer entrance.
However, smaller vehicles do not automatically have permission to use loading bays, restricted roads or pedestrian-priority areas. Access depends on local rules, vehicle classification, permits and operating conditions.
The smaller vehicle may also have lower carrying capacity. If its parcels cannot fit safely into one trip, reloading can erase any time saved at individual stops.
A simple break-even calculation helps determine when the smaller vehicle is worthwhile.
In a hypothetical comparison, suppose a car saves two minutes per stop across 20 deliveries. That creates 40 minutes of potential time savings. If limited capacity requires an additional depot trip taking 45 minutes, the car loses its apparent advantage before accounting for other operational differences.
The appropriate decision therefore depends on parcel volume, dimensions, safe load capacity, parking conditions and the total time required to complete the assigned workload.
Vehicle selection also affects appointment reliability. Easier access can make stop durations more consistent, potentially reducing the amount of buffer required around narrow windows. That benefit should be measured rather than assumed.
Local environmental regulations add another constraint. In London, for example, Transport for London‘s ULEZ rules for vans and minibuses specify emissions requirements for covered vehicles. The published daily charge for non-compliant vehicles is 12.50 GBP, and eligibility depends on declared emissions rather than size alone.
Other cities may apply different access restrictions or emissions standards. A small car is not automatically exempt from them, and a compliant van may be equally eligible for access.
Before switching vehicle classes, compare total route duration, achievable drop capacity, reload requirements, regulatory compliance and the cost of operating each option.
A better vehicle choice can remove recurring friction, but consistent delivery performance ultimately depends on how the whole route responds to daily changes.
Key takeaways before rebuilding a recurring route
- Separate persistent route problems from ordinary daily fluctuations before changing the delivery sequence.
- Protect strict appointment windows with observed service times and risk-based allowances, not distance estimates alone.
- Review the route, driver procedures and assigned vehicle together; improvements in one area may be offset by constraints elsewhere.
How to Make Recurring Delivery Routes Predictable When Traffic Changes Daily?
Recurring delivery routes become more predictable when dispatchers maintain a proven base sequence, plan around recurring traffic patterns and respond selectively to unexpected disruption. The goal is not to eliminate every delay or recalculate every stop each morning. It is to control variation, identify meaningful changes early and protect customer appointments without sacrificing unnecessary delivery capacity.
A practical reliability system has three layers, each requiring a different operating response.
| Planning layer | What it covers | Operational response |
|---|---|---|
| Stable baseline | Regular addresses, expected stop durations and established access arrangements | Maintain a reference route and update it when persistent changes are confirmed |
| Predictable variation | Rush hours, recurring market days, scheduled local events and known busy periods | Apply time-specific travel estimates and adjusted delivery sequencing |
| Unexpected disruption | Incidents, sudden closures, customer access failures and vehicle problems | Reassess remaining stops, protect feasible commitments and communicate changes |
This structure avoids two common extremes: treating every day as identical or rebuilding the entire route whenever traffic changes.
Reliability should be measured through both average route duration and route-duration variability. A route that usually finishes quickly but occasionally misses several appointments may be less useful than one with a slightly longer but more consistent completion time.
Standard deviation provides one way to track variability across several weeks. Calculate it using comparable shifts, then interpret the result alongside on-time delivery rate, parcel volume, missed windows and the frequency of major incidents.
For example, a hypothetical route with completion times of 180, 181, 179 and 180 minutes is more consistent than one taking 160, 175, 190 and 195 minutes. The first route has less variation even though the second sometimes finishes earlier. These figures illustrate the measurement principle; they are not observed industry results.
Do not compare variability across fundamentally different workloads without adjusting for stop count, delivery requirements and operating conditions.
Each completed shift should contribute to an improvement cycle:
- Record actual travel and stop-service times against the planned schedule.
- Identify whether missed appointments came from driving, access, sequencing or vehicle-related interruptions.
- Update category-specific service allowances and the timing of predictable congestion.
- Check whether the route still fits its committed delivery windows under realistic uncertainty.
- Review sustained changes and revise the baseline when the existing route structure no longer performs adequately.
The distinction between ordinary variation and structural deterioration matters. An isolated traffic incident may require only a temporary diversion. Repeated delays at the same intersection or building may require a permanent sequence change, revised appointment commitments or different vehicle allocation.
Repeatedly increasing buffers around an obsolete route can hide the problem while reducing the number of deliveries that fit into a shift.
A useful review therefore asks whether the route still meets its required on-time delivery rate at acceptable capacity. If not, reassess route geography, stop allocation and delivery windows instead of automatically adding more slack.
For the next recurring shift, choose one route, record its planned and actual times, and identify the largest controllable source of delay. Make one operational adjustment, then compare the next set of comparable shifts. Sustainable on-time delivery comes from repeating that measurement-and-correction cycle, not from chasing the shortest line on a map.
What is the difference between on-time arrival and on-time delivery?
On-time arrival measures whether the driver reaches the destination by the required time. On-time delivery measures whether the shipment meets the agreed completion milestone, which may require handover or recorded delivery confirmation. Dispatchers should define the contractual milestone clearly and record arrival and completion separately to avoid misleading performance figures.
Which delivery performance metrics should dispatchers monitor first?
Begin with on-time delivery rate, missed delivery windows, actual versus planned stop duration and total route completion time. Add the main recorded delay reason for each exception. These measurements help distinguish unrealistic planning from problems drivers can address through access preparation, route sequencing or vehicle readiness.
Should drivers make up lost time by driving faster?
No. Drivers must obey speed limits, traffic laws and safe-driving requirements. When a route falls behind, the appropriate response is to reassess the remaining schedule, seek an authorised change in stop order, notify dispatch and update affected customer expectations. Unsafe driving is not an acceptable route-recovery strategy.
How much historical data is needed before changing a delivery route?
There is no universal minimum number of shifts. The required evidence depends on how frequently the route runs, the variability of its workload and the size of the proposed change. Start collecting comparable daily observations, separate exceptional incidents from recurring patterns and avoid major structural decisions based on one unusually slow shift. Significant safety or access problems may require immediate action regardless of sample size.
Can better routing software solve late deliveries without changing driver procedures?
Routing software can improve sequencing and account for changing traffic when supplied with suitable information, but it cannot automatically correct inaccurate service times, unreported access problems or vehicle defects. Effective route optimisation depends on accurate operational inputs, reliable driver feedback and practical procedures for responding to exceptions.